Sometimes I am fond of trying new tools even I have already a toolkit, just for having fun. In this case, I researched about valgrind suite, in particular callgrind. Callgrind is a profiling tool that records the call trace among functions in a program’s run as a call-graph. By default, the collected information consists of the number of instructions executed, the caller/callee relationship between functions, the numbers of such calls…
So, let’s try to use callgrind to run a process to get all the API calls like a sandbox monitor use to do. To collect the information, we can run it like this:
valgrind --tool=callgrind --dump-instr=yes --collect-jumps=yes program
This will create a bunch of files at the current working directory with this format: callgrind.out.$PID. These files contain all the execution details.
We can use kcachegrind to analyze the information, this is a desktop application which parses the dumped files to analyze all the information.
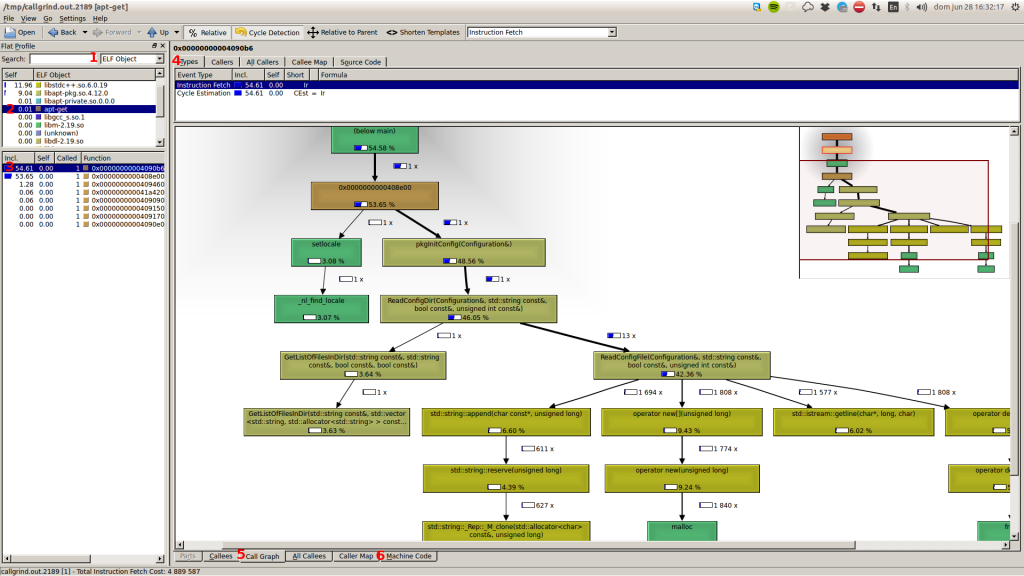
In this example we will analyze the “apt-get update” command. Once you open the output file with kcachegrind, we will select the ELF Object (1), we will choose the object (2), select the branch to analyze (3), go to types (4) and display the call graph (5).

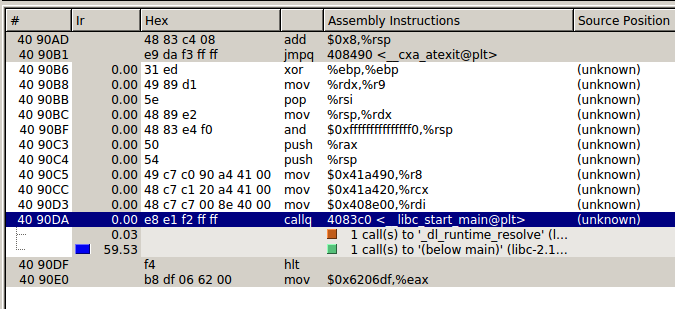
Now, you can optionally inspect the assembly executed (6)

 Jose Ramon Palanco
 Inside HAVEX